IEA's 95-million-barrel August stock draw hides opposite regional moves
The IEA estimates that observed global oil inventories fell by 95 million barrels in August, but the components moved in different directions: oil on water and non-OECD stocks declined while OECD stocks rose. The distinction matters because a higher OECD total did not reverse the worldwide draw or prove that fuel was available where shortages were most acute.
The International Energy Agency's September Oil Market Report estimates a 95 million barrel fall in observed global oil inventories during August 2026. The headline figure describes a worldwide net change, not a uniform drain from every storage tank. The same report says oil on water fell by 65 million barrels and non-OECD inventories by 52 million, led by China, while OECD inventories increased by 23 million barrels. The three rounded components broadly reconcile with the reported global decline. They also show why a positive regional stock figure cannot be read as proof that the wider market was replenished.
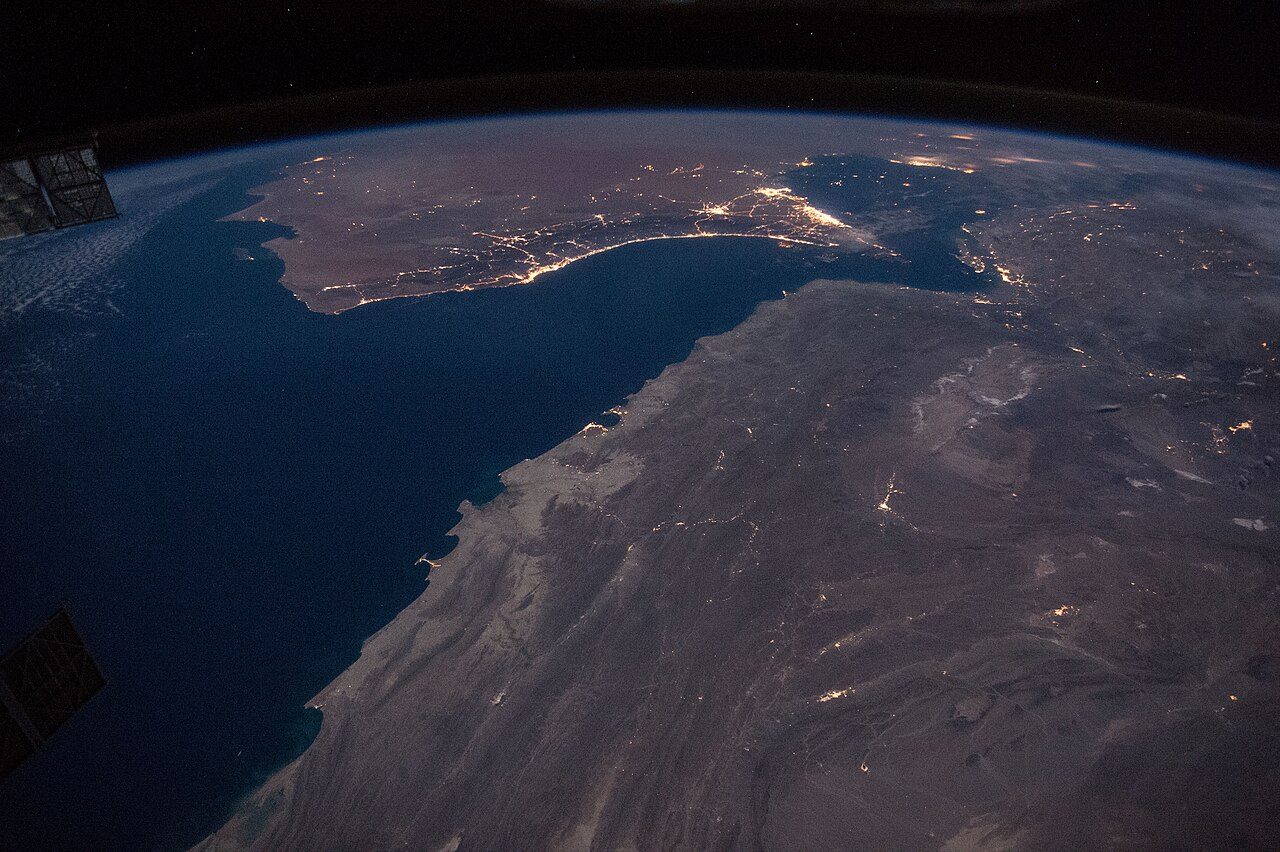
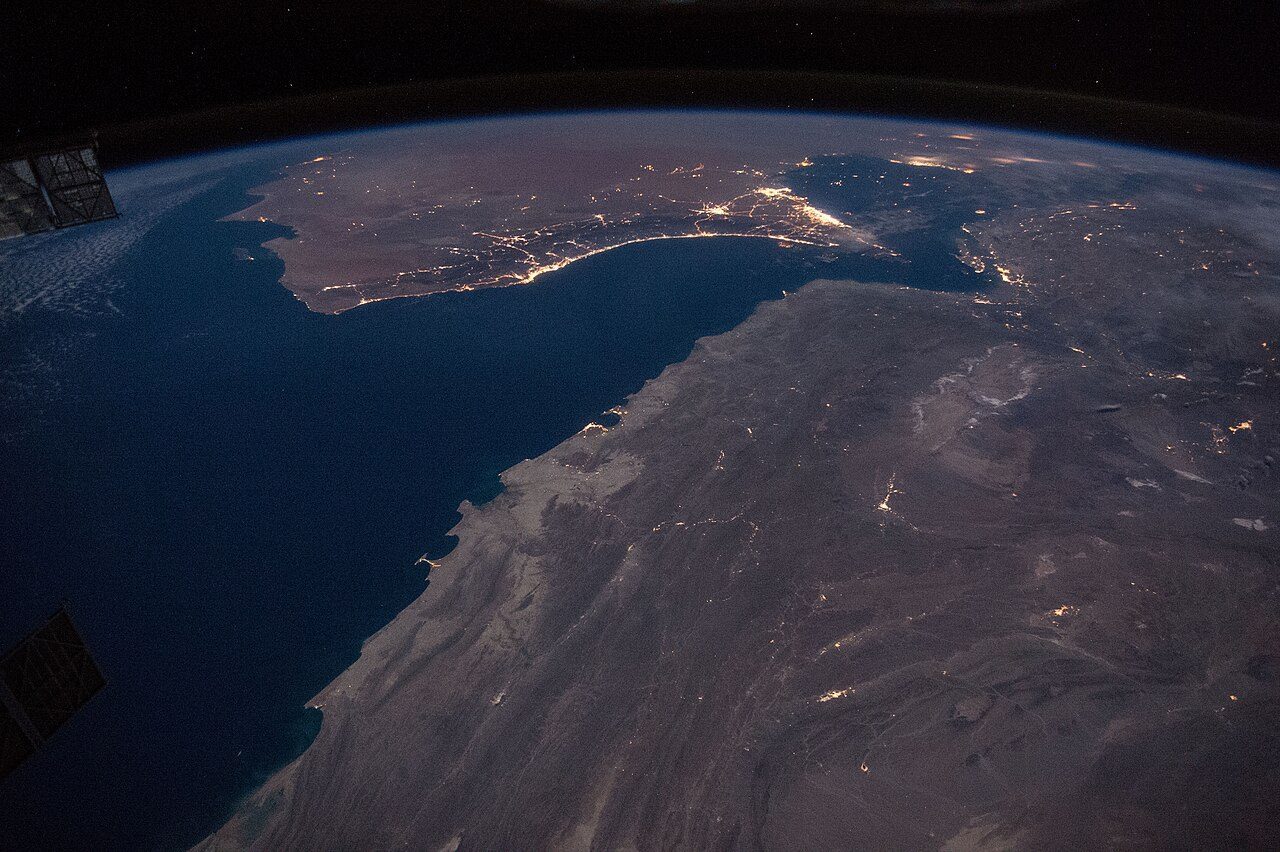
Oil on water is a particularly important part of that arithmetic. It is oil carried or stored aboard ships, not necessarily a delivery available to a refinery on demand. The IEA links the August fall in seaborne volumes to renewed attacks on tanker traffic from the Middle East. A reduction there can lower the global observed total even while stocks in a different region's land-based tanks rise. The report does not say that every missing barrel at sea was consumed, nor does its public summary identify the final destination of each cargo.
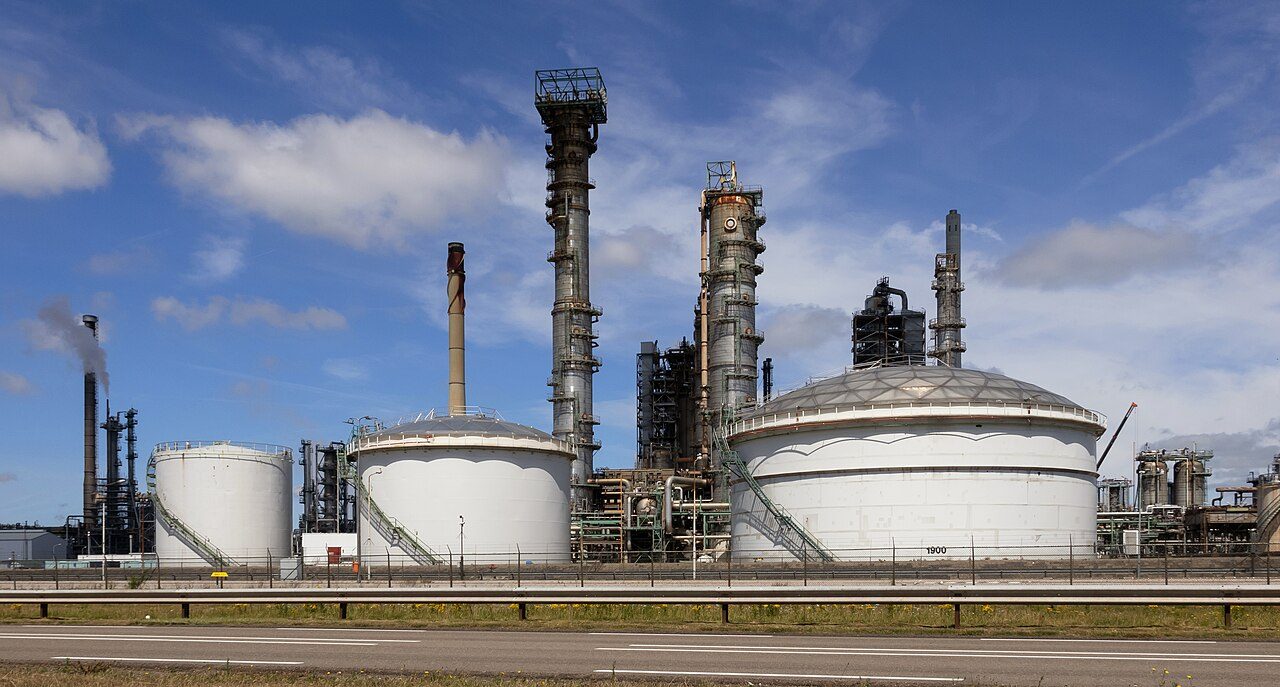
Within the OECD, the agency says builds in commercial tanks more than offset a 19 million barrel reduction in government stocks, producing the net 23 million barrel increase. Commercial inventories and emergency holdings therefore moved in opposite directions. Treating the OECD's positive net figure as an increase in every type of stock would erase the draw in government reserves. Conversely, treating the global 95 million barrel decline as a fall in OECD commercial stocks would be wrong.
The monthly change also sits inside a longer draw. The IEA estimates that observed stocks were down 507 million barrels since February, the start of the war period used in its September report. Its August edition had estimated a 69 million barrel fall in July and about 410 million barrels of cumulative decline through the end of that month. Those are successive snapshots with updated estimates and cut-off dates; adding rounded monthly figures to an earlier cumulative figure is not a substitute for the agency's latest series. The useful comparison is direction and scale: the August draw continued a sequence rather than cancelling it.
A stock build in one OECD category offers a buffer, but it says little by itself about the location, product mix or delivery time needed by users elsewhere. The IEA's September analysis separately describes severely constrained Gulf exports of refined products and liquefied petroleum gas, and a refining system working near its limits. The inventory table should be read alongside those product-flow constraints. Crude in storage, fuel already aboard a ship and diesel ready for consumption are not interchangeable without transport and refining capacity.
These are IEA estimates published on 11 September, not a real-time tally for 29 September. The public report gives aggregate categories rather than a country-by-country explanation of the August change in the cited highlights. New tanker movements, emergency-stock decisions or revisions to underlying observations could alter a later release. For readers assessing supply risk, the defensible conclusion is narrower than either “stocks everywhere collapsed” or “OECD stocks solved the shortage”: the worldwide net fell sharply while the location and ownership of the remaining barrels differed.
 프리즘코리아 편집국 > 서유진 · Yujin Seo